TRIP Report Calculates Poor Roads, Bridges Cost New York City Area Motorists Nearly $37 Billion
NEW YORK—Roads and bridges that are deteriorated, congested or lack some desirable safety features cost New York motorists a total of $36.7 billion statewide annually—$3,697 per driver in the New York-Newark-Jersey City urban area—due to higher vehicle operating costs, traffic crashes and congestion-related delays.
The cost for motorists in the Poughkeepsie-Newburgh- Middletown region is $2,037 per year. Increased investment in transportation improvements could relieve traffic congestion, improve road, bridge and transit conditions, boost safety, and support long-term economic growth in New York, according to a new report released recently by TRIP, a Washington, DC based national transportation research nonprofit.
The TRIP report, “New York Transportation by the Numbers: Meeting the State’s Need for Safe, Smooth and Efficient Mobility,” found that throughout New York, nearly half of major locally and state-maintained roads are in poor or mediocre condition, 9% of locally and state-maintained bridges (20 feet or more in length) are rated poor/structurally deficient, and the state’s traffic fatality rate has increased significantly since 2019. New York’s major urban roads are congested, causing significant delays and choking commuting and commerce.
The TRIP report includes statewide and regional pavement and bridge conditions, congestion data, highway safety data, and cost breakdowns for the Albany-Schenectady-Troy, Binghamton, Buffalo-Niagara Falls, New York-Newark-Jersey City, Poughkeepsie-Newburgh- Middletown, Rochester, Syracuse and Utica urban areas.
“Long-term, sustained transportation funding is needed to allow New York to move forward with necessary improvements to its transportation network that will make the state’s roads and bridges smoother, safer and more efficient while boosting the economy and creating jobs,” said Dave Kearby, TRIP’s executive director. “In addition to the federal investment, it will be critical that New York continues to increase its level of transportation investment.”
Driving on roads in the New York-Newark-Jersey City urban area costs the average driver $1,894 per year in the form of extra vehicle operating costs (VOC) as a result of driving on roads in need of repair, lost time and fuel due to congestionrelated delays, and the costs of traffic crashes in which the lack of adequate roadway safety features, while not the primary factor, likely were a contributing factor.
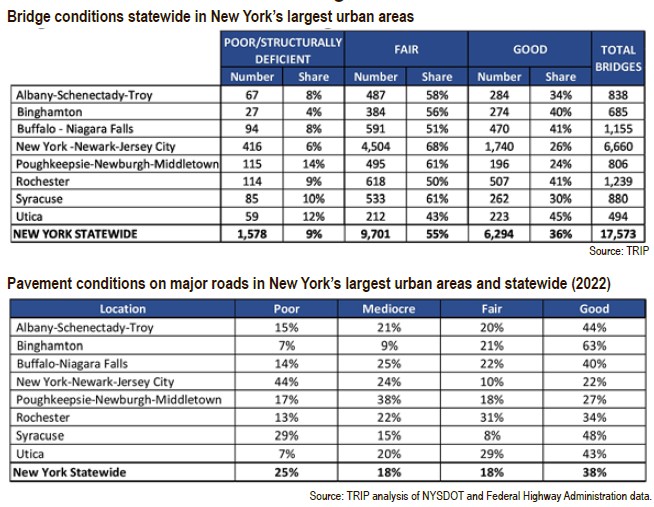
The TRIP report found that 44% of major locally and statemaintained roads in the New York-Newark-Jersey City urban area are in poor condition and another 24% are in mediocre condition, costing the average motorist an additional $880 each year in extra vehicle operating costs, including accelerated vehicle depreciation, additional repair costs, and increased fuel consumption and tire wear. Statewide, 25% of New York’s major roads are in poor condition and 18% are in mediocre condition.
In the New York-Newark- Jersey City urban area, 6% of bridges are rated poor/structurally deficient, with significant deterioration to the bridge deck, supports or other major components. In that region, 68% of the area’s bridges were rated fair and only 26% of the metro area’s total number of bridges (6,660) were rated good. Statewide, 9% of New York’s bridges are rated poor/structurally deficient. In the Poughkeepsie-Newburgh- Middletown area, 14% of the region’s bridges were rated poor or structurally deficient, with 61% rated fair and only 24% of the total 806 bridges rated good.
Traffic congestion in the New York-Newark-Jersey City urban area causes 91 annual hours of delay for the average motorist and costs the average driver $2,459 annually in lost time and wasted fuel. New York-Newark-Jersey City drivers waste an average of 37 gallons of fuel per motorist annually due to congestion.
Statewide, drivers lose $16.8 billion annually as a result of lost time and wasted fuel due to traffic congestion. Due to the COVID-19 pandemic, vehicle travel in New York dropped by as much as 45% in April 2020 (as compared to vehicle travel during the same month the previous year). By the close of 2022, vehicle miles of travel in New York had rebounded to 9% below 2019’s pre-pandemic levels. During the first nine months of 2023, as compared to the first nine months of 2022, New York VMT increased 4%, the third largest increase in the nation during that time.
Other Key Findings
- Traffic crashes in New York claimed the lives of 5,207 people between 2018 and 2022. In the New York-Newark- Jersey City urban area, on average, 607 people were killed in traffic crashes each year from 2017 to 2021.
- The number of fatalities in New York increased 23% from 2019 to 2022, from 931 to 1,148, and the state’s fatality rate per 100 million VMT increased 39% during that time, from 0.75 to 1.02.
- Improvements to New York’s roads, highways and bridges are funded by local, state and federal governments. The level of federal highway investment is set to increase as a result of the five-year Infrastructure Investment and Jobs Act (IIJA), signed into law by President Biden in November 2021, which resulted in a 50% increase in annual federal funding for New York.
- During 2022 and the first half of 2023 the Federal Highway Administration’s national highway construction cost index, which measures labor and materials cost, increased by 36%.
- The design, construction and maintenance of transportation infrastructure in New York supports approximately 319,000 full-time jobs across all sectors of the state economy. Approximately 3.5 million fulltime jobs in New York in key industries like tourism, retail sales, agriculture and manufacturing are dependent on the quality, safety and reliability of the state’s transportation infrastructure network.