NYC Metro Housing Costs Soar by 68% in Last Decade
ALBANY—Housing costs in New York City and the surrounding suburbs have skyrocketed by more than 68% over the last decade, the largest increase among selected major metropolitan areas in the U.S., according to a new report from New York State Comptroller Thomas P. DiNapoli released on Jan. 12.
“Housing costs in New York City and the surrounding suburbs have risen dramatically over the last decade,” Mr. DiNapoli said. “When we look at other major U.S. metropolitan areas, we see New York’s housing costs have grown at a greater rate. More than half of tenants in the city spend 30% of their income on rent, forcing them to make tough choices. City and state leaders recognize New York’s housing affordability problem but need to implement cost-effective solutions more quickly.”
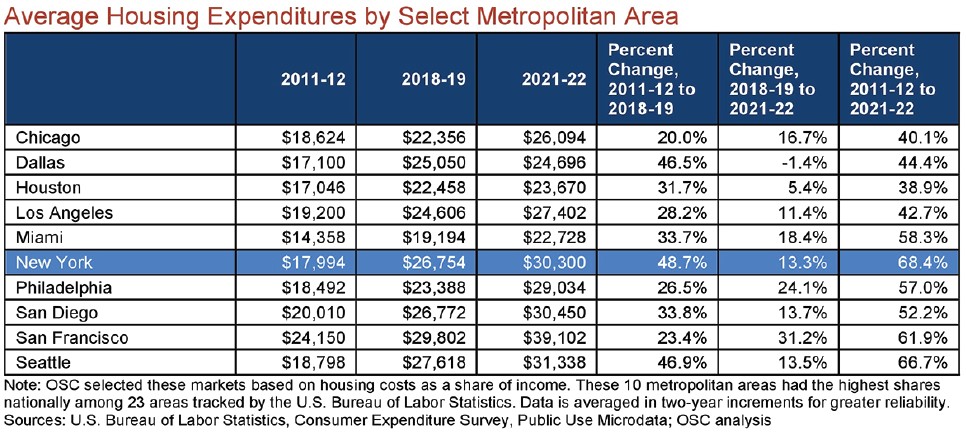
Since 2011, housing costs, which include shelter (mortgage payments, rent and property taxes), utilities, operations/ maintenance, and furnishings reached an all-time high in the New York City metro area, which includes the city as well as Nassau, Suffolk, Westchester and Rockland counties. In 2021-2022 homeowners or renters spent an average of $30,300 on housing costs, only trailing the San Francisco and Seattle metro areas, reflecting 40% of their total household expenses, compared to 34% nationally.
Renters Most Burdened By Housing Costs
One million tenants or 53% of households spent over 30% of their income on rent in 2021, which has remained significantly high over the last decade. In Brooklyn and Queens, a greater share of moderate- and middle-income households in 2021 spent more than 50% of their income on rent than in 2011.
After a dip in 2020, rents rose in 2021 and 2022, and more people in New York City fell behind on their payments. In June 2021, 26% of rental households in the metro area were behind on rent, greater than almost 15% nationally.
While the largest share of households that fell behind on rent were low-income, 22% of moderate-income households on Staten Island and 8% of middle-income households in Brooklyn also fell behind. As of October 2023, 18% of city residents were behind on rent, compared to 12% nationally. Over the last two years, missed rent payments have risen among New York City Housing Authority property residents as NYCHA collected only 61% of rent as of November 2023.
Economic Headwinds Restrict Supply
A halt in construction during the pandemic, a lapsing of the real estate property tax exemption program known as 421-a, and higher interest rates have all contributed to a slowdown in housing development. Mr. DiNapoli’s report noted the city has taken some action to support the development of new housing and has released proposals to create new incentives to boost production.
In 2023, the city completed almost 13,900 affordable units through the first 10 months of the year, but it has not been enough to keep up with demand. Permits for new residential buildings, which include new market rate units, declined by 85% in the first eight months of 2023.
Outlook
“The city and state continue to discuss the affordable housing crisis in New York City, making incremental steps towards an equitable solution for all,” the report stated. “Slow progress and a more difficult financing environment have made the issue more acute and pressing. Policy solutions that are cost-effective and practicable are needed quickly to jump start the city’s housing affordability efforts, both for residents now and for the city’s long-term desirability as a hub for talent.”
High Cost of NYC Housing Reflected in Key Takeaways
- ‘But You Must Pay the Rent’: In June 2021, 26% of rental households in the New York City metropolitan area were behind on rent compared to 15% nationally. In October 2023, it was 18%, better than before but still worse than the nation’s 12%.
- In 2021, over 1 million households (53%) citywide were rent burdened, spending over 30% of income on rent. As the most populous borough, Brooklyn had the greatest rent burden at 323,136 households.
- In 2022, property taxes made up over 27% of homeowner costs citywide, on average, compared to 22.6% nationally.
- Vacancies were high among more expensive studio units, with 52.7% of units priced at $2,300 or more and 22.4% of those priced between $1,500 and $2,299 vacant in 2021.
- Brooklyn saw the largest increase in newly completed or preserved affordable units between 2014 and 2023, fueled by a twofold increase between 2017 and 2018, but the Bronx has added more affordable units since the beginning of the pandemic.
- In 2023, building permits fell by 85% in the first eight months, following a surge in activity ahead of the expiration of the 421-a program in 2022.
- The biggest decline in permits was among the largest multi-family buildings (100+ units), which dropped 91% in the first eight months of 2023.
- The report stated that continued development of affordable housing in the Bronx may be particularly valuable to ease affordability issues in the city’s housing market. In 2021, the Bronx had the lowest net rental vacancy rate citywide at about 0.8% whereas Manhattan had the highest at more than 10.0%. The highest vacancy rates in Manhattan, as well as citywide, were among units with asking rents of $2,300 or more. Contrastingly, there were very few units with asking rents of less than $900, driving the relatively low vacancy rates in the outer boroughs and especially the Bronx.